Introduction
The colony formation assay is the gold-standard technique to assess cell viability after treatment with cytotoxic reagents, ionizing radiation, and cytotoxic combinatorial treatments. However, manually counting the resulting cell colonies is a laborious task in which consistent objectivity is difficult to achieve. The brief article below will touch on some of the issues researchers trying to complete these large library screens may face and why these groups may want to consider an automated option. Finally, at the bottom of this article, we have included a reference section with several relevant protocols and studies that have used our automated colony counting and sizing platform, the GelCount, to aid in different library screens which should be relevant to researchers looking at screening 2D and 3D colonies, spheroids, and even organoids.
Manual library screening
As library screens frequently comprise researchers looking at 10’s to 1000’s of compounds or drugs often in triplicates (or greater), it is essential they have a way to quickly quantify counts. To complete library screens without some sort dedicated imaging and colony counting/sizing analysis software is difficult if not an impossible task for most labs to undertake. To maintain consistency in data acquisition, utilising colony-based assays often requires that a single observer counts colonies in hundreds, potentially thousands of cultures. As you add more individuals into the mix, which would certainly be needed for a larger-scale assay, inter-observer variability and even bias can create counting disconnects from well to well and plate to plate. Furthermore, becoming proficient at colony scoring and at eliminating ‘background noise’ takes time. Meanwhile, observer fatigue over hours of counting further leads to diminishing accuracy and reproducibility of colony quantification.
This is all further compounded if colonies are too small to count by eye, which is the case for most 3D colony examples. Scientists will typically numerate 3D colonies under a microscope across the X, Y and Z planes, while only being able to view a small part of the entire well at any one time. As well as being hugely labour intensive, manual colony counting utilising a microscope has been shown to result in a significant increase in the degree of intra and inter-observer variability.
Automating colony counting in large screens
Oxford Optronix’s automated colony counting and image analysis system, the GelCount, offers an efficient and cost-effective alternative to manual counting, delivering a significant reduction in turnaround time resulting from high sample throughput of library screens. This automated image acquisition and analysis approach to colony counting has been validated and found to provide superior accuracy and precision compared to manual observer counting, reducing both intra- and inter-observer variation. Through its high depth of field imaging combined with powerful object detection algorithms, the GelCount provides unsurpassed colony detection performance, including the resolution of overlapping colonies and differentiation of real colonies from debris or other artefacts.
The GelCount also offers two other major advantages relative to manual counting. First, alongside garnering colony counts, researchers also can collate detailed colony size information with the GelCount. The ability to quantitatively measure the effects of therapeutic treatments on not only absolute colony numbers, but also on colony diameter makes it possible for research teams to greatly extend the sensitivity of the colony forming assay, by revealing information relating to colony growth dynamics that might otherwise not be extracted from colony counts alone.
Second, the GelCount delivers unparalleled data capture and export capabilities. These extend from basic colony counts and mean colony statistics, delivered directly into Microsoft Excel, to full digital image archiving. Images of colony plates or dishes can be saved in a general-purpose bitmap format for presentations or print output into lab documentation, or in a digital raw image format that supports the future processing or reprocessing of images even when the physical plates are long gone.
Library screen protocols and publications
The GelCount can deliver dramatic accuracy, productivity and throughput enhancements for researchers involved in drug discovery, radiobiology, or toxicology research. The publications below offer several ways the GelCount opens the door to teams looking at ambitious new projects that will advance the frontiers of research – including large-scale combinational library studies.
Hatch S. et al. 2022
Automated 96-well format high throughput colony formation assay for siRNA library screen
Utilized the GelCount in a protocol for a library of 960 siRNAs pools; Key protocol steps 35-40
Johnson T. et al. 2021
Quantifying cell cycle-dependent drug sensitivities in cancer using a high throughput synchronisation and screening approach
Used the GelCount in a library Screen of 235 anti-cancer compounds; Figure 1c, 4b, 4c
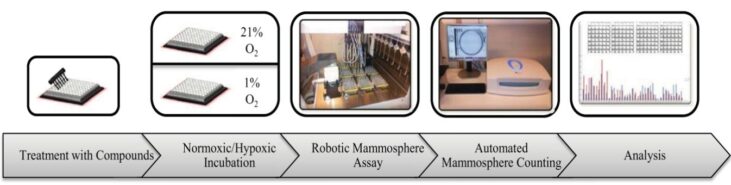
Fitzpatrick P. et al. 2017
Robotic Mammosphere Assay for High-Throughput Screening in Triple-Negative Breast Cancer
The GelCount was used in the screening of 989 FDA-approved drugs; Figure 1a, 2a, 2c
Dompe N. et al. 2018
A CRISPR screen identifies MAPK7 as a target for combination with MEK inhibition in KRAS mutant NSCLC
GelCount was utilized in seemingly hundreds of clonogenic assays in a CRISPR screen; Figure 5a, 5b
Download this article
Author: Justin Croft, May 2022